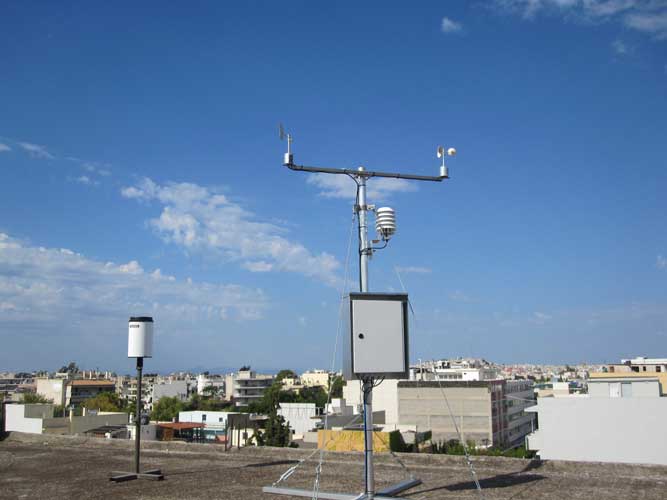
Automatic Weather Station - Moschato Athens GR
The weather now
| Date of measurements | Thu 19-02-2026 08:30:00 UTC |
| Air temperature | 14.9 ° C |
| Relative humidity | 37.8 % |
| Wind speed | 0.3 m/s (1 Beaufort, 0.6 Knots) |
| Wind direction | 217.4 ° (SW - Libeccio) |
| Air pressure | 1017.6 mbar |
| Rainfall | 0.0 mm |
| Dew point | 0.6 ° C |
| Discomfort index | 13.7 (Cool) |
| Maximum wind speed | 1.9 m/s (2 Beaufort, 3.7 Knots) |
NOTE: Above measurements are 2 min averages of 10 sec scans. The web page values are updated automatically from the measurement station every 2 minutes. The sectors coloured ■■■ represent the wind direction variability during the 2 min interval.
Measurement station time is in UTC. Local station time is UTC +2 hours. UTC is the Universal Time Coordinated.
Last hour graphs up to 08:30 UTC
Moving the mouse pointer over the chart curves you can see the measurement and the corresponding point in time
Last hour wind direction and speed graph up to 08:30 UTC
The concentric circles represent records of the last 60 min at 4 min intervals, with the latest value represented by the outer circle (hour 08:30 UTC). Dots between circles correspond to intermediate measurements at 2 min intervals. The vectorial mean wind direction for the last 60 min is presented by the ■■ radius with current value 239.7 ° (WSW - Ponente-Libeccio). Only measurements with wind speed > 0.00 m/s are taken into account in the calculation The colour of the dots represents the wind speed in accordance with the colour code which follows.
Wind speed
| Color | Beaufort | m/sec | Knots |
|---|---|---|---|
| 0 | 0 - 0.3 | 0.0 - 0.6 | |
| 1 | 0.3 - 1.6 | 0.6 - 3.1 | |
| 2 | 1.6 - 3.4 | 3.1 - 6.6 | |
| 3 | 3.4 - 5.5 | 6.6 - 10.7 | |
| 4 | 5.5 - 8 | 10.7 - 15.6 | |
| 5 | 8 - 10.8 | 15.6 - 21.0 | |
| 6 | 10.8 - 13.9 | 21.0 - 27.0 | |
| 7 | 13.9 - 17.2 | 27.0 - 33.4 | |
| 8 | 17.2 - 20.8 | 33.4 - 40.4 | |
| 9 | 20.8 - 24.5 | 40.4 - 47.6 | |
| 10 | 24.5 - 28.5 | 47.6 - 55.4 | |
| 11 | 28.5 - 32.7 | 55.4 - 63.6 | |
| 12 | >= 32.7 | >= 63.6 |
Last 24 hour values graphs up to 08:00 UTC
Moving the mouse pointer over the chart curves you can see the measurement and the corresponding point in time
(*) The chart is derived from the mean vectorial hourly values.
Last 14 days graphs up to 18-02-2026
Moving the mouse pointer over the chart curves you can see the measurement and the corresponding point in time
Automatic Measurement Station information

The Automatic Weather Station (AWS) is property of Scientific Enterprises Ltd and it is located on the terrace of the central offices of the company at Moschato, Athens, Greece.
The measurement station elevation is 25 m and the location coordinates are: 37° 57' 28.10'' N, 23° 41' 6.56'' E.
The installed equipment is the following:
| Description | Model | Manufacturer |
|---|---|---|
| Data logger | CR800 | Campbell Scientific Ltd |
| Ethernet interface card | NL201 | Campbell Scientific Ltd |
| Air pressure sensor | RPT410V | Druck Ltd |
| Temperature & rel. humidity sensor | HC2-S | Rotronic A.G. |
| Wind speed sensor | Α100R | Windspeed Ltd |
| Wind direction sensor | W200P | Windspeed Ltd |
| Rainfall sensor | 52203 | R.M. Young Co |
| Multi-Plate Radiation Shield | 41003P | R.M. Young Co |
Download measurements
It is possible to download 2 min measurements in a comma separated values (CSV) form. By clicking on the buttons below you can download measurements of the last hour, the current month or the last month. It is also possible to download measurements for a user selectable time period through the use of the RESTful API which is supported by our web application. If you are interested in this feature please contact us. You may find the contact information in our web page www.scienter.gr .
Messaging services
It is possible for our web application to e-mail you a warning message in case of recording measurements exceeding values you have set for some of the parameters measured by the AWS. For this service please contact us.
Copyright © 2026 EnviΜετ Web View App v.1.1 developed by Scientific Enterprises Ltd | Privacy policy | Terms of Use
Powered by mymeasurements.eu cloud service

